
Understanding chart patterns is crucial for technical analysis in Forex Trading. Forex chart patterns help in analyzing the market trend and provide valuable insights on the potential trend reversals (buy), breakouts (sell), and price targets (hold your currency).
Below are the top ten forex chart patterns that beginners should know. These patterns have been proven to be effective in predicting market movements and can give you an edge in your trading journey.
Note: It’s important to remember that while chart patterns are helpful, they shouldn’t be the only factor to consider. For a well-rounded trading approach, a trader should also use other tools like technical indicators, fundamental analysis, and risk management strategies.
Top 10 Beginner-Friendly Forex Chart Patterns For Technical Analysis
Here are some powerful and best forex chart patterns for beginners to perform a less-risk technical analysis. Traders can use them to get a brief about the market and make an informed decision for their investments. Minimize the risk and book maximum profit with the help of these easy-to-learn simple forex chart patterns. According to the best forex institute in Jaipur, Vaishvik Traders, lot of successful forex traders are seen using these powerful forex patterns and you can use them too to give a boost to your portfolio.
1. Double Top and Double Bottom
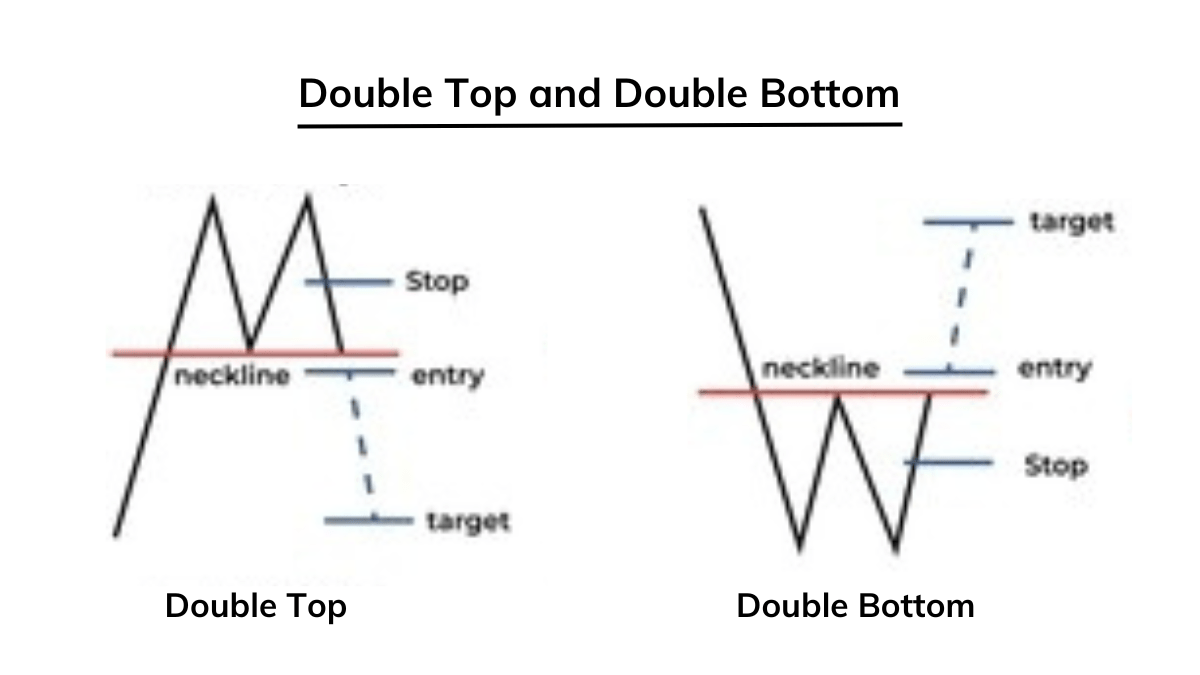
A double top pattern forms when the price reaches a resistance level twice and fails to break above it. This pattern suggests a potential trend reversal from bullish to bearish. Traders look for a break below the trough (support level) to confirm the pattern.
Here’s a breakdown of the Double Top pattern:
- Uptrend: The pattern forms after a sustained upward movement in price, indicating a bullish trend.
- First Peak: The price reaches a peak, encountering resistance at a specific level.
- Trough: After the first peak, the price retraces and forms a trough (support level), often showing a temporary pause in buying pressure.
- Second Peak: The price rallies again to reach a similar level as the first peak, but fails to break above the resistance.
- Confirmation: The pattern is confirmed when the price breaks below the trough (support level), signaling a reversal of the prior uptrend.
- Price Target: Traders often measure the distance from the trough to the resistance level and project it downwards from the breakout point to estimate a potential price target.
The double bottom pattern is the opposite, with the price hitting a support level twice and failing to break below it, indicating a potential trend reversal from bearish to bullish. Traders look for a break above the peak (resistance level) to confirm the pattern.
Here’s a breakdown of the Double Bottom pattern:
- Downtrend: The pattern forms after a sustained downward movement in price, indicating a bearish trend.
- First Bottom: The price reaches a bottom, finding support at a specific level.
- Peak: After the first bottom, the price rebounds and forms a peak (resistance level), often showing a temporary halt in selling pressure.
- Second Bottom: The price declines again to reach a similar level as the first bottom but fails to break below the support.
- Confirmation: The pattern is confirmed when the price breaks above the peak (resistance level), signaling a reversal of the prior downtrend.
- Price Target: Traders often measure the distance from the peak to the support level and project it upward from the breakout point to estimate a potential price target.
2. Head and Shoulders
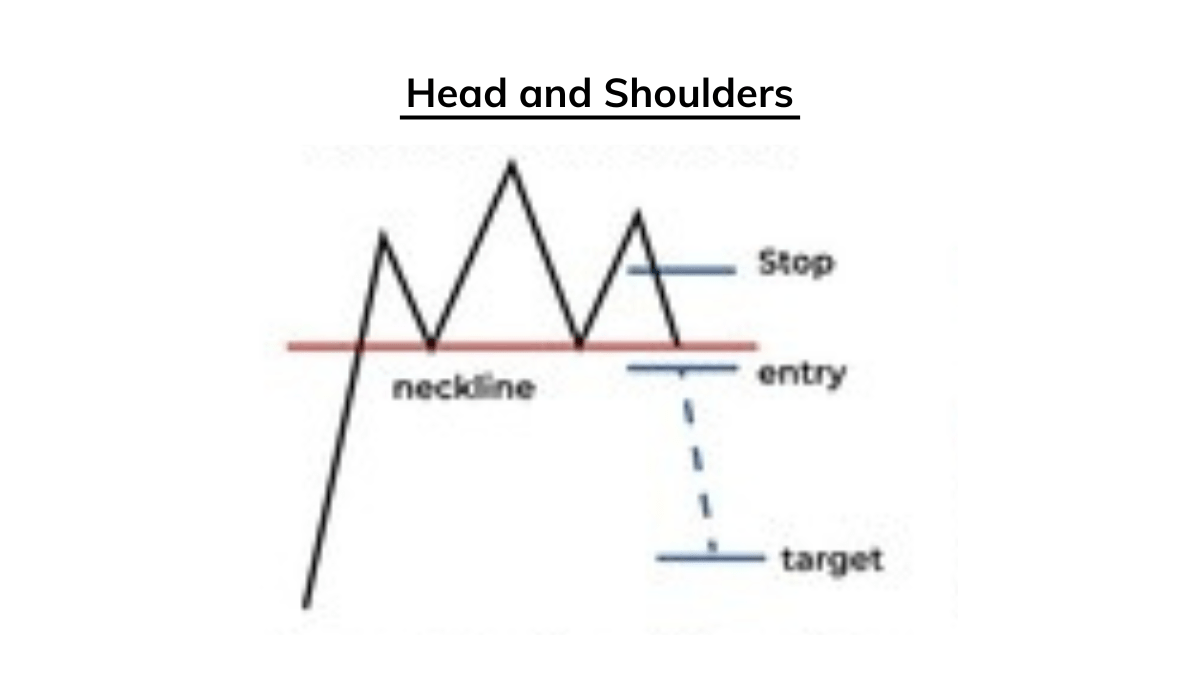
The head and shoulders pattern consists of three peaks, with the middle peak (the head) being the highest, and the other two forming the shoulders. This pattern typically occurs at the end of an uptrend and indicates a potential trend reversal from bullish to bearish.
Here’s a breakdown of the Head and Shoulders pattern:
- Left Shoulder: The left shoulder is formed when the price reaches a peak, followed by a decline. It represents the first attempt of buyers to push the price higher but fails to sustain the upward momentum.
- Head: The head is formed when the price rallies again, surpassing the previous peak, and then declines. The head represents the highest point reached during the pattern and often coincides with increased buying pressure followed by significant selling pressure, indicating the potential exhaustion of bullish momentum.
- Right Shoulder: The right shoulder is formed when the price rallies once more, but fails to surpass the head’s high, followed by another decline. The right shoulder is typically lower than the head and resembles the left shoulder in terms of price action.
- Neckline: The neckline is a support level that connects the lows of the left shoulder, head, and right shoulder. It acts as a critical level in the pattern, and a break below the neckline confirms the pattern.
- Volume: Volume analysis is important in confirming the validity of the pattern. Generally, volume tends to be higher during the formation of the head, indicating increased market participation, while volume may decrease during the formation of the right shoulder.
- Confirmation: The pattern is confirmed when the price breaks below the neckline. Traders often wait for a candlestick close below the neckline to ensure the validity of the pattern.
- Price Target: To estimate the potential price target, traders often measure the distance from the neckline to the head and project it downward from the neckline breakout point. This projected distance is often considered the target for the subsequent bearish move.
3. Inverse Head and Shoulders Forex Chart Pattern

The inverse head and shoulders pattern is the mirror image of the head and shoulders pattern. It indicates a potential trend reversal from bearish to bullish. The pattern consists of three troughs, with the middle trough (the head) being the lowest, and the other two forming the shoulders.
Here’s a breakdown of the Inverse Head and Shoulders pattern:
- Left Shoulder: The left shoulder is formed when the price reaches a low point, followed by a bounce. It represents the first attempt of sellers to push the price lower but fails to sustain the downward momentum.
- Head: The head is formed when the price declines again, surpassing the previous low, and then bounces. The head represents the lowest point reached during the pattern and often coincides with increased selling pressure followed by a significant buying pressure, indicating a potential exhaustion of bearish momentum.
- Right Shoulder: The right shoulder is formed when the price declines once more, but fails to surpass the head’s low, followed by another bounce. The right shoulder is typically higher than the head and resembles the left shoulder in terms of price action.
- Neckline: The neckline is a resistance level that connects the highs of the left shoulder, head, and right shoulder. It acts as a critical level in the pattern, and a break above the neckline confirms the pattern.
- Volume: Similar to the Head and Shoulders pattern, volume analysis is important in confirming the validity of the Inverse Head and Shoulders pattern. Generally, volume tends to be higher during the formation of the head, indicating increased market participation, while volume may decrease during the formation of the right shoulder.
- Confirmation: The pattern is confirmed when the price breaks above the neckline. Traders often wait for a candlestick close above the neckline to ensure the validity of the pattern.
- Price Target: To estimate the potential price target, traders often measure the distance from the neckline to the head and project it upward from the neckline breakout point. This projected distance is often considered the target for the subsequent bullish move.
4. Ascending and Descending Triangles

Another important chart pattern used in the technical analysis of forex charts is Ascending and Descending Triangles. It gives useful insights to the trader about the potential future price movements to take the appropriate informational decision and book maximum profit. Let’s take a closer look at this chart pattern.
Ascending Triangle
In a forex chart, we see an ascending triangle when the price consolidates between a horizontal resistance level and a rising trendline. The resistance level remains relatively flat, while the lower trendline slopes upwards. It is a bullish continuation pattern that usually forms during an uptrend.
Descending Triangle
A descending triangle is a bearish continuation pattern that typically forms during a downtrend. When the price consolidates between a horizontal support level and a descending trendline. The support level remains relatively flat, while the upper trendline slopes downwards.
Buy & Sell Strategy for Ascending and Descending Triangles forex chart pattern for beginners.
Buy Strategy: In a forex chart, look for an entry point when the price breaks above the horizontal resistance level. Then, confirm the breakout which is generally with an increase in volume, indicating strong buying interest. Finally, measure the distance from the lowest to the highest point within the triangle and project this distance upward from the breakout point for a potential target.
Sell Strategy: Look for an entry point when the price breaks below the horizontal support level. Confirm the breakout with an increase in volume, indicating strong selling interest. Then, measure the distance from the highest to the lowest point within the triangle and project this distance downward from the breakout point for a potential target.
5. Symmetrical Triangle

Another useful forex chart pattern is The Symmetrical Triangle which is a continuation pattern that forms when the price consolidates, creating converging trendlines. This pattern is called “symmetrical” because both the upper and lower trendlines meet at a roughly equal slope, thus, creating a triangle shape. This pattern suggests a period of indecision in the market before a potential breakout.
In an uptrend, the symmetrical triangle forex pattern suggests a brief pause before potentially resuming the upward movement. However, In a downtrend, this pattern indicates a temporary halt before a potential continuation of the downward trend.
To form this forex pattern, connect at least two highs with a descending trendline (resistance). Then, connect at least two lows with an ascending trendline (support). These both trendlines meet at an apex, forming a symmetrical triangle.
6. Rectangle
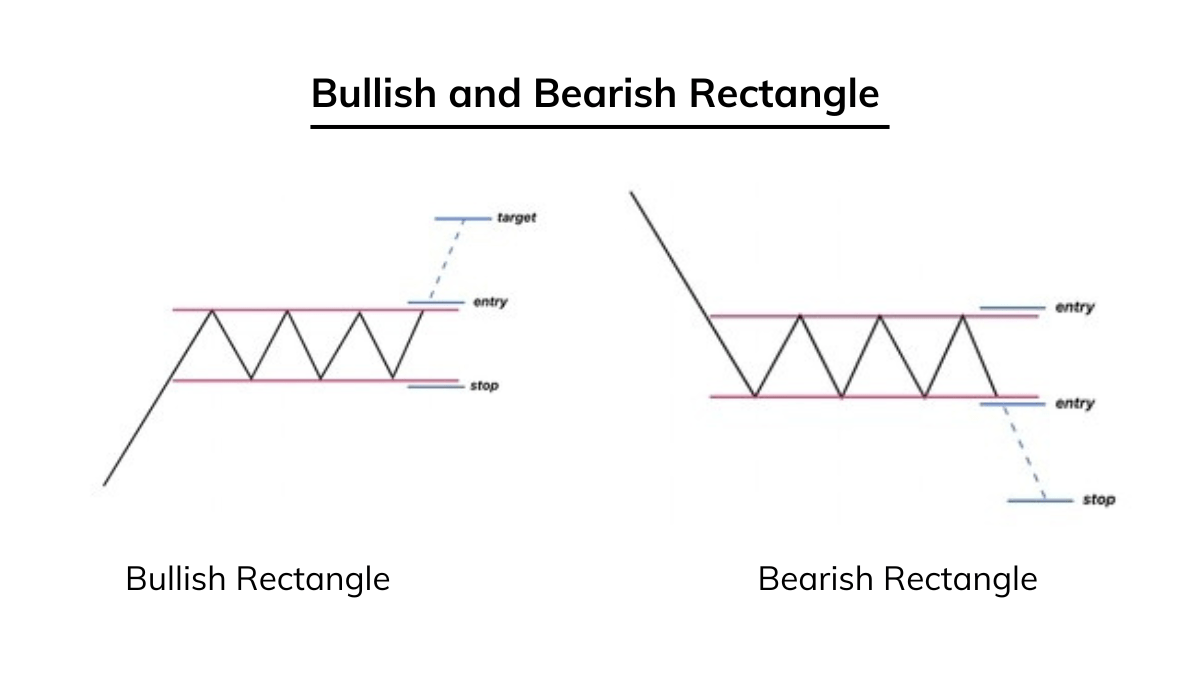
Another popular forex chart pattern is a Rectangle chart pattern, also known as a trading range or congestion area. This technical analysis pattern is seen when the price of an asset moves within horizontal support and resistance levels. It signifies a period of consolidation or indecision in the market before a potential breakout or breakdown.
In this chart pattern, the rectangle can occur in both uptrends and downtrends. In an uptrend, this chart suggests a temporary pause before potentially continuing the upward movement. However, In a downtrend, the chart indicates a brief consolidation before a potential continuation of the downward trend.
To form a support, connect at least two lows with a horizontal line, and connect at least two highs with another horizontal line parallel to the first to form a resistance. Measure the height of the rectangle (from support to resistance) and project this distance from the breakout point to estimate the potential price target. To manage risk, set a stop-loss just on the opposite side of the breakout point.
7. Bullish and Bearish Flags

Our next forex chart pattern is Bullish and Bearish flag patterns which are short-term continuation patterns that typically occur after a strong price movement. They resemble a flag on a flagpole, hence the name, Bullish and Bearish flag. These patterns are considered as a brief consolidation before the prior trend resumes.
Bullish Flag Pattern
We see a Bullish flag pattern after a strong upward price movement resembling a rectangular flag that slopes against the prevailing trend (downward slope).
Formation: There is an initial strong upward price movement, forming the flagpole. Afterward, a consolidation phase occurs where the price forms a rectangular flag shape with a slight downward slope.
Bearish Flag Pattern
Similar to bullish flags, bearish flags are typically short-term. It occurs after a strong downward price movement and resembles a rectangular flag that slopes against the prevailing trend (upward slope).
Formation: A flagpole is formed due to the initial strong downward price movement. After the pole, a consolidation phase occurs where the price forms a rectangular flag shape with a slight upward slope.
8. Pennant
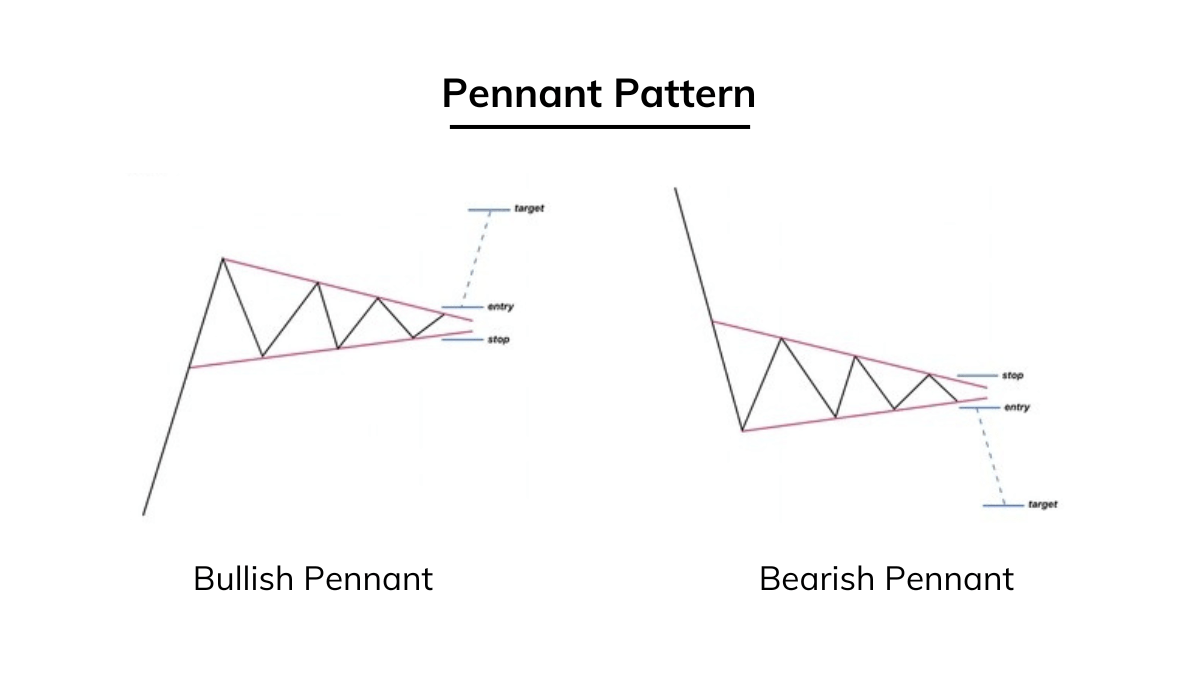
Another technical analysis forex chart pattern for beginner traders is the Pennant, which appears as a small symmetrical triangle, or sometimes a small symmetrical wedge, within a larger price movement. It is considered a continuation pattern, suggesting that after a brief consolidation, the previous trend is likely to resume. Pennants are similar to flags, but their consolidation period is characterized by converging trendlines rather than parallel ones.
A bullish pennant can be seen after a strong upward price movement. However, a bearish pennant can be seen after a strong downward price movement.
Pennant are short-term patterns that typically last from a few days to several weeks.
9. Wedge

Wedge formation resembles a triangle but is characterized by converging trendlines that do not necessarily have to be symmetrical. There are two main types of wedge patterns i.e. rising wedges and falling wedges. Both of them are considered reversal patterns, but they can also act as continuation patterns in some instances.
Rising Wedges
With both the support and resistance lines slanting in the same direction, a rising wedge slopes upward. This technical analysis forex chart pattern can form over various timeframes, indicating a temporary pause in the prevailing downtrend.
Typically, we see a rising wedge formation after a prolonged downtrend. Here, the price forms higher highs and higher lows, but these peaks and troughs converge toward each other.
Falling Wedges
Opposite the rising wedges, a falling wedge slopes downward, with both the support and resistance lines slanting in the same direction. Its formation can happen over various timeframes, indicating a temporary pause in the prevailing uptrend.
A falling wedge formation can be seen after a prolonged uptrend. The price forms lower highs and lower lows, but these peaks and troughs converge toward each other.
10. Hammer and Shooting Star

Our next forex chart pattern for beginner traders that provides valuable insights into potential trend reversals is Hammer and Shooting Star. These candlestick forex patterns are widely used in technical analysis and are formed by a single candlestick.
Hammer
Talking about the shape, the hammer has a small real body (either bullish or bearish) with a long lower shadow (at least two times the length of the real body) and its upper shadow is small or non-existent.
Talking about the Hammer Interpretation, the long lower shadow indicates that sellers pushed prices significantly lower during the session, but buyers managed to bring the price back up, closing near the open.
Hammer occurs after a downtrend suggesting a potential reversal in the downtrend.
Shooting Star
The shooting star has a small real body (either bullish or bearish) having a long upper shadow (at least two times the length of the real body) and a small or non-existent lower shadow.
Occurring after an uptrend, this shooting star forex chart pattern suggests a potential reversal in the uptrend.
The long upper shadow in this pattern indicates that buyers pushed prices significantly higher during the session. But sellers managed to bring the price back down, closing near the open.
Conclusion
Combining these powerful forex chart patterns with some other powerful indicators, a trader can create a comprehensive trading strategy and increase the probability of successful trades. Take a look at this article by NirmalBang, to know more about some powerful forex indicators.
With practice and experience, beginner traders can easily understand and recognize these forex patterns, thus, improving their entry and exit points. Utilize these top forex chart patterns to perform successful trades during your trading journey.
FAQs
The head and shoulders and the triangle are the two most common forex chart patterns that occur regularly. They indicate a strong price action and trend reversal that are easy to identify. Beginner traders can use them to analyze the chart and make an entry or exit trade accordingly.
While performing a technical analysis, a lot of things are needed to be considered. As a beginner, you can use some basic forex chart patterns i.e. Head & Shoulders and Double Top & Bottom patterns along with some indicators to make informed decisions. Read about them in detail along with the above given other beginner-friendly forex chart patterns and always look for the breakout. Utilize them during your trading journey and see the results.